Network Statistics: TON at a Glance on DYOR.io
DYOR now has a page for the TON network itself: transactions a day, addresses, Gram supply, staking APY and validators, with charts from one month to all time. Here is what each figure tells you and where to find it.

TON is more than its tokens. To see how the network itself is doing (how busy it is, how fast it grows, how much Gram is in circulation and what staking pays), open Network statistics at dyor.io/stats.
Every figure on the page is live, so the screenshots below show one moment, not today's values.
📡 The network right now
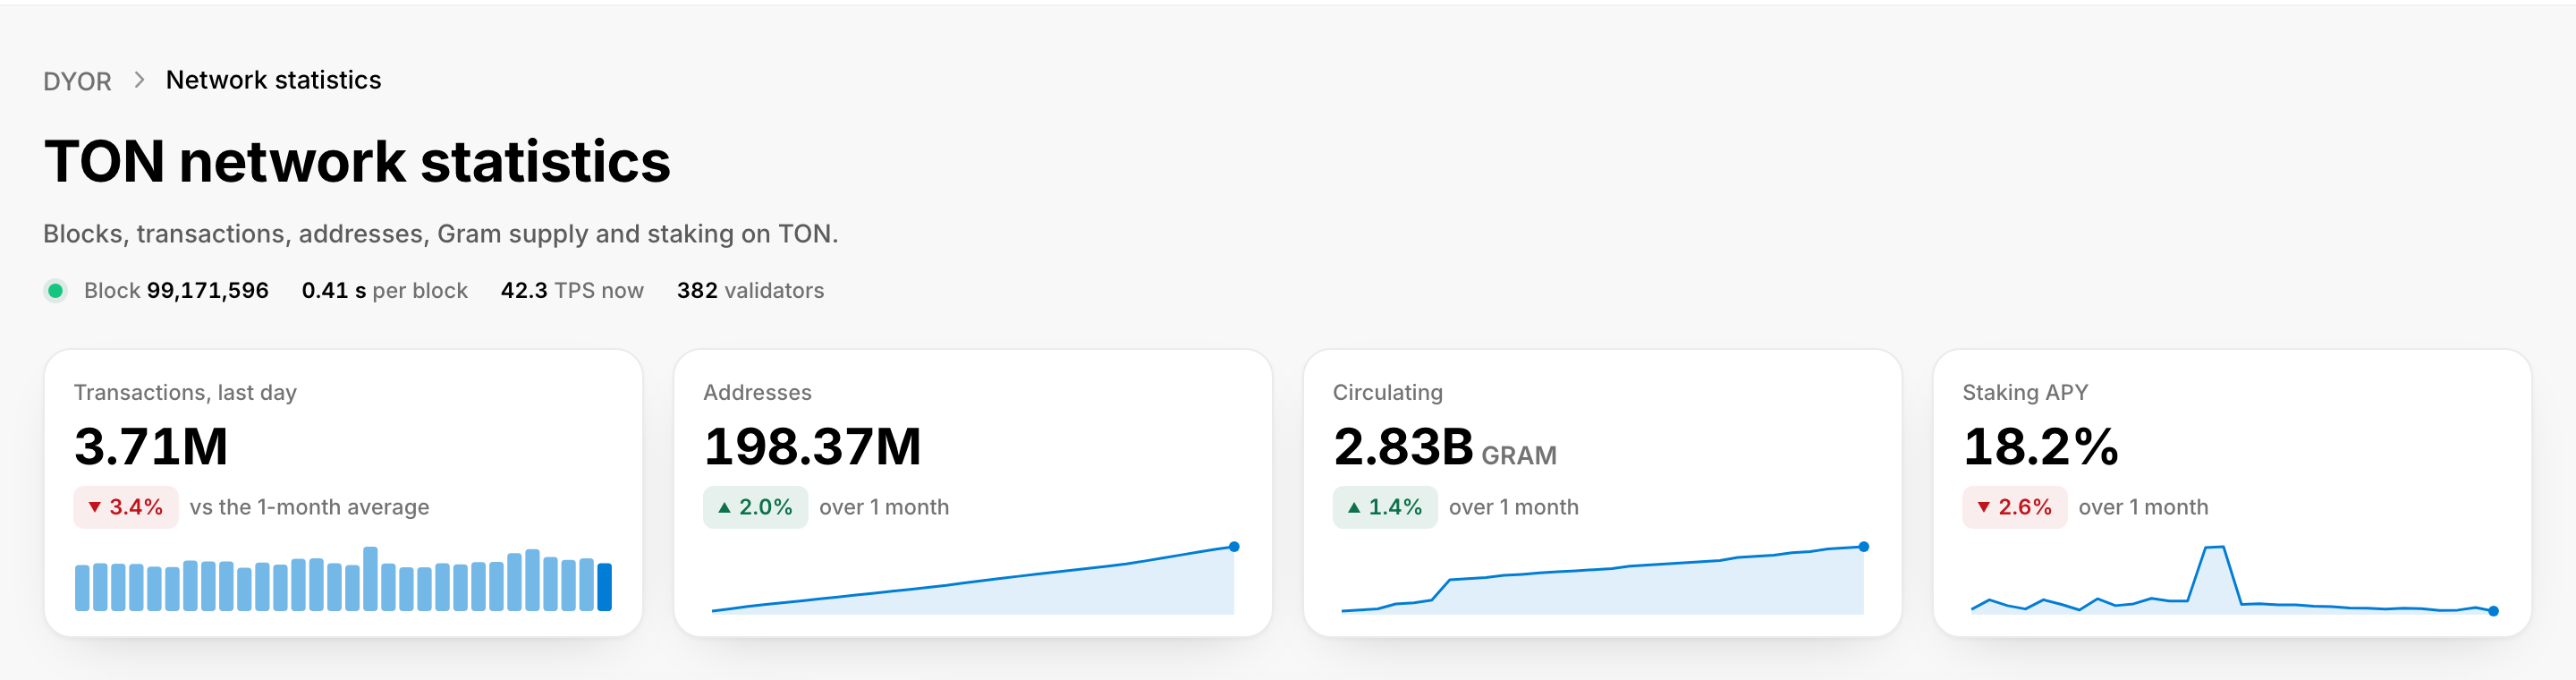
Under the title, TON network statistics, a live line shows the latest masterchain Block, the time per block, TPS now (transactions per second over the last minute) and the validators of the current round. A green dot in front of the line means the figures are live. If the live TPS is missing, you see TPS, day average instead. While the page is open, it asks for fresh figures every minute.
📊 Four key figures
Four tiles sum up the network. Each has a 30-day sparkline and its change over the last month:
- Transactions, last day: the transactions of the last full day, against the month's average a day.
- Addresses: every address on TON. The change is the addresses added this month, against the number there were at its start.
- Circulating: how much Gram is in circulation, and how that changed over the month.
- Staking APY: the yearly yield of the last validation round. Its change is a plain percentage of the APY itself, not percentage points.
🗂 Five cards and a period switch
Below the tiles, five cards go deeper. Every card but the Gram market has its own switch: 1M, 3M, 1Y and All. Each opens on 1M, and its chart and its change follow the period you pick. Hover over a chart to see the date and value of any point.
Gram market
Gram's price in USD with its 24-hour change, Market cap, FDV and Volume 24h, and a chart of the dollar price over the last 30 days. These come from DYOR's own market data, the same as on the Gram page (Open the Gram page).
Transactions
The average a day over the period, then In the period (the total), Last full day (its ⓘ names the UTC day) and TPS now. The change compares the mean of the period's last seven full days with its first seven. On long periods each bar is a week or a month, and shows the average a day within it.
Addresses
The total, New in the period, Average a day and Last day, with a chart of the total over time.
Gram supply
The total supply and its change, a bar that splits it into In circulation and Not in circulation, a chart of circulating Gram, and the total's Growth in a year.
Staking
The APY of the last round and its change over the period, charts of the APY and of the Gram Staked per round, Total staked (the Gram held by the elector contract, which keeps the validators' stakes) and the Validators of the current round.
The network figures come from on-chain data.
🔎 How to read them
- Is the chain busy? A last day far above the month's average on its tile means something drew people on-chain; the tokens table on the home page shows where the volume went.
- Is TON growing? Addresses counts addresses, not people: one person can hold many. Read its chart as a trend over months rather than as a head count.
- How much Gram can reach the market? The supply bar shows how much of the total is in circulation, and Growth in a year how fast the total itself grows.
- What does staking pay? Staking APY is what the last round paid, expressed per year. It moves from round to round, so look at its chart over 3M or 1Y before you draw a conclusion.
📍 Where to find it
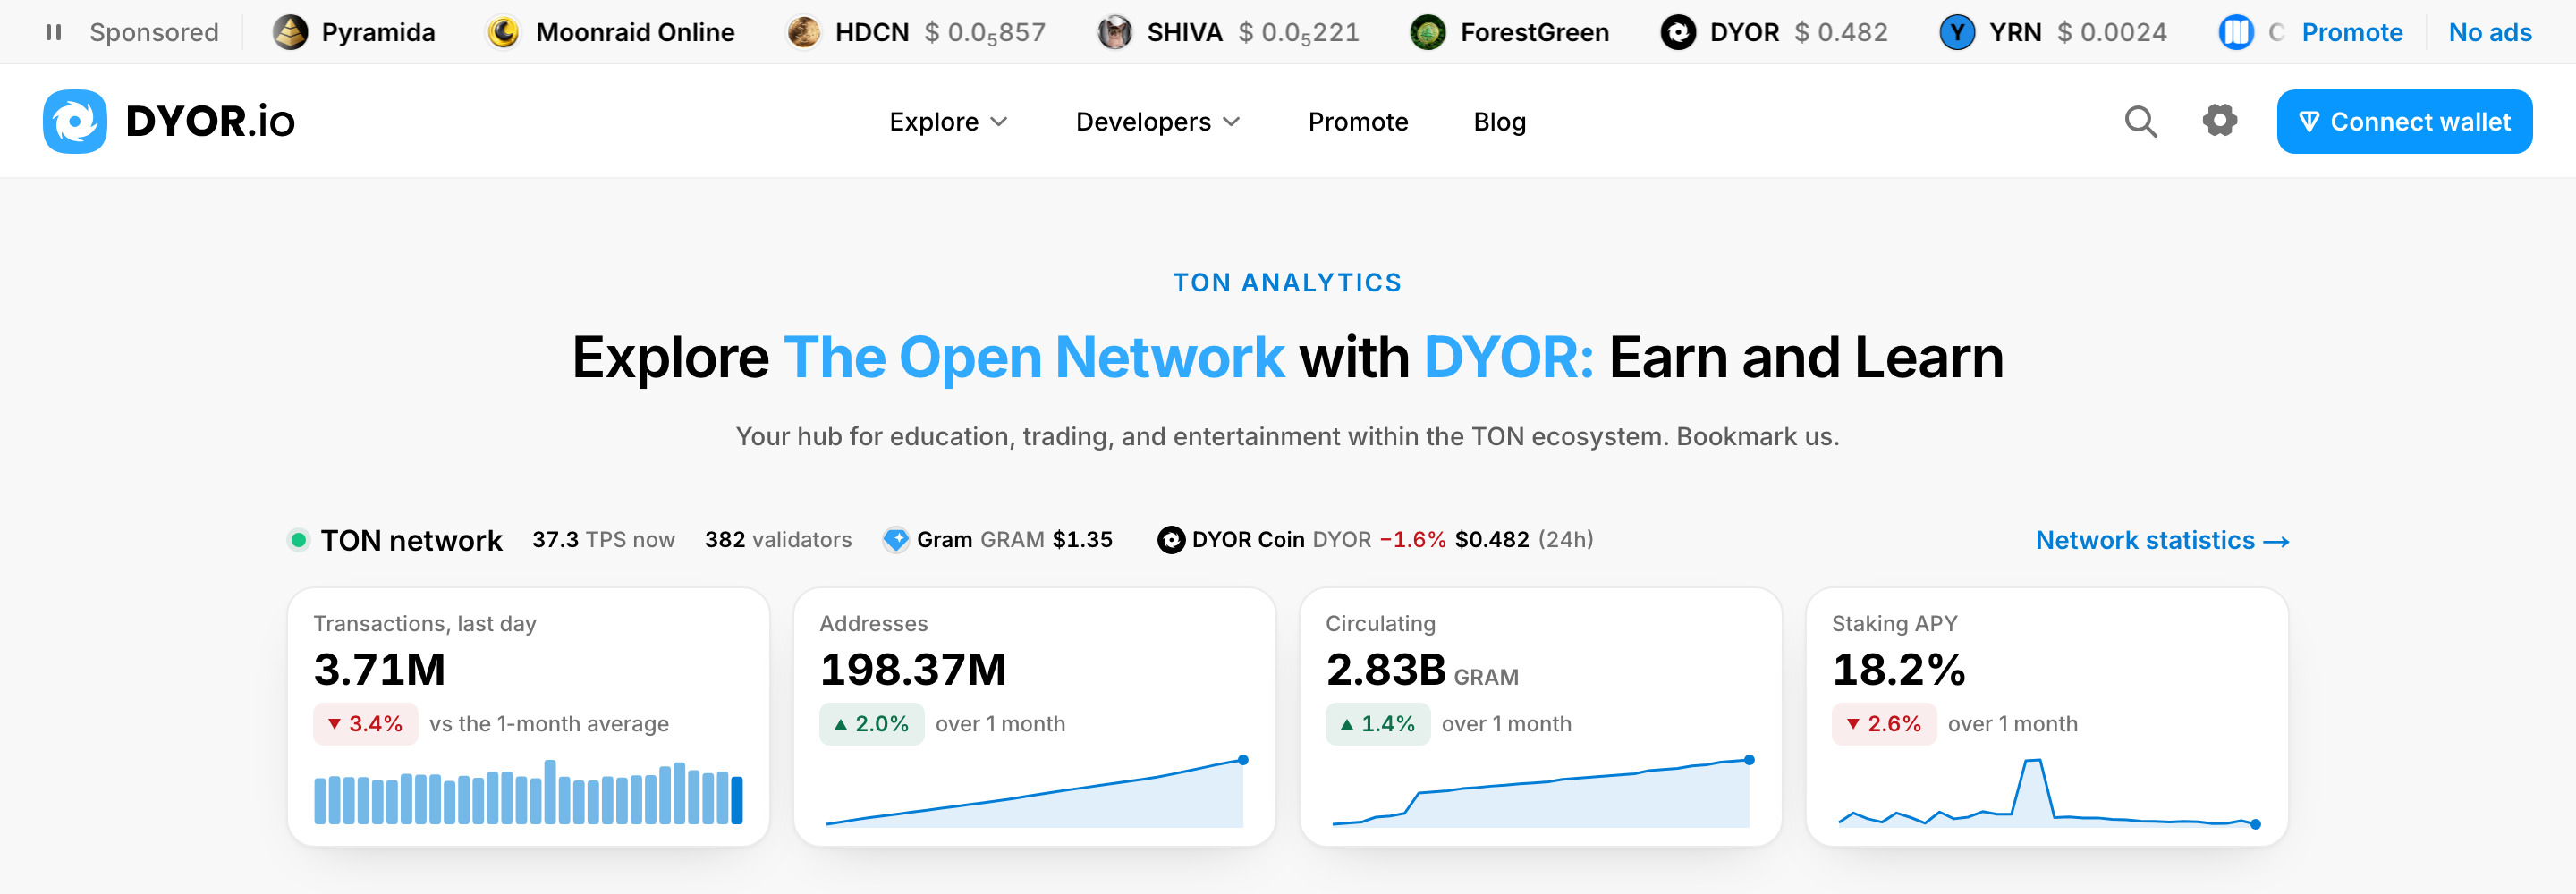
- On the home page. The TON network block under the headline shows the TPS, the validators, the GRAM and DYOR prices and the same four tiles. Each tile, and Network statistics →, opens the page. The home page shows the figures as they were when it loaded.
- In the Explore menu. Network Statistics, with the New badge. On a phone, tap Menu in the bottom bar.
- In the footer, under Product.
- On the Gram page. Network statistics → sits under the coin's figures at dyor.io/token/gram.