How to Read Crypto Charts - Part 2
In the first part of the article on cryptocurrency charts, we covered the basics: candlestick charts, support and resistance levels. But this is just the start of a trader’s journey. If you're ready to take it to the next level, in this article, we will dive into advanced techniques that will allow you to better feel the market and make more precise decisions. We will discuss key indicators, patterns, and wave analysis - tools that give professional traders an edge over the rest.
Advanced Chart Analysis Techniques
For those aiming to elevate their cryptocurrency chart analysis, basic indicators alone are not enough. It is crucial to know how to combine them for more accurate and confident signals. This is where the true "masters" of analysis come into play - RSI (Relative Strength Index), MACD (Moving Average Convergence Divergence), and the stochastic oscillator.
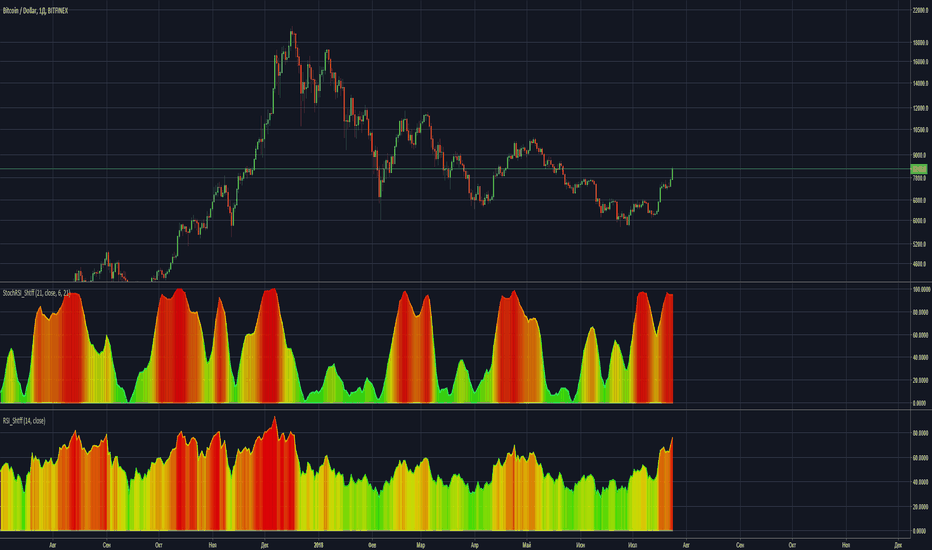
RSI and Its Application
RSI, or the Relative Strength Index, acts as your compass, showing whether an asset is overbought or oversold. It oscillates between 0 and 100, and when the value rises above 70, a downward correction is likely - indicating the asset is overbought and caution is advised. On the other hand, if RSI is below 30, the asset is oversold, signaling that growth may soon follow. However, be cautious: in strong trends, RSI can remain at extreme values, indicating that the market is either overheated or too cold.
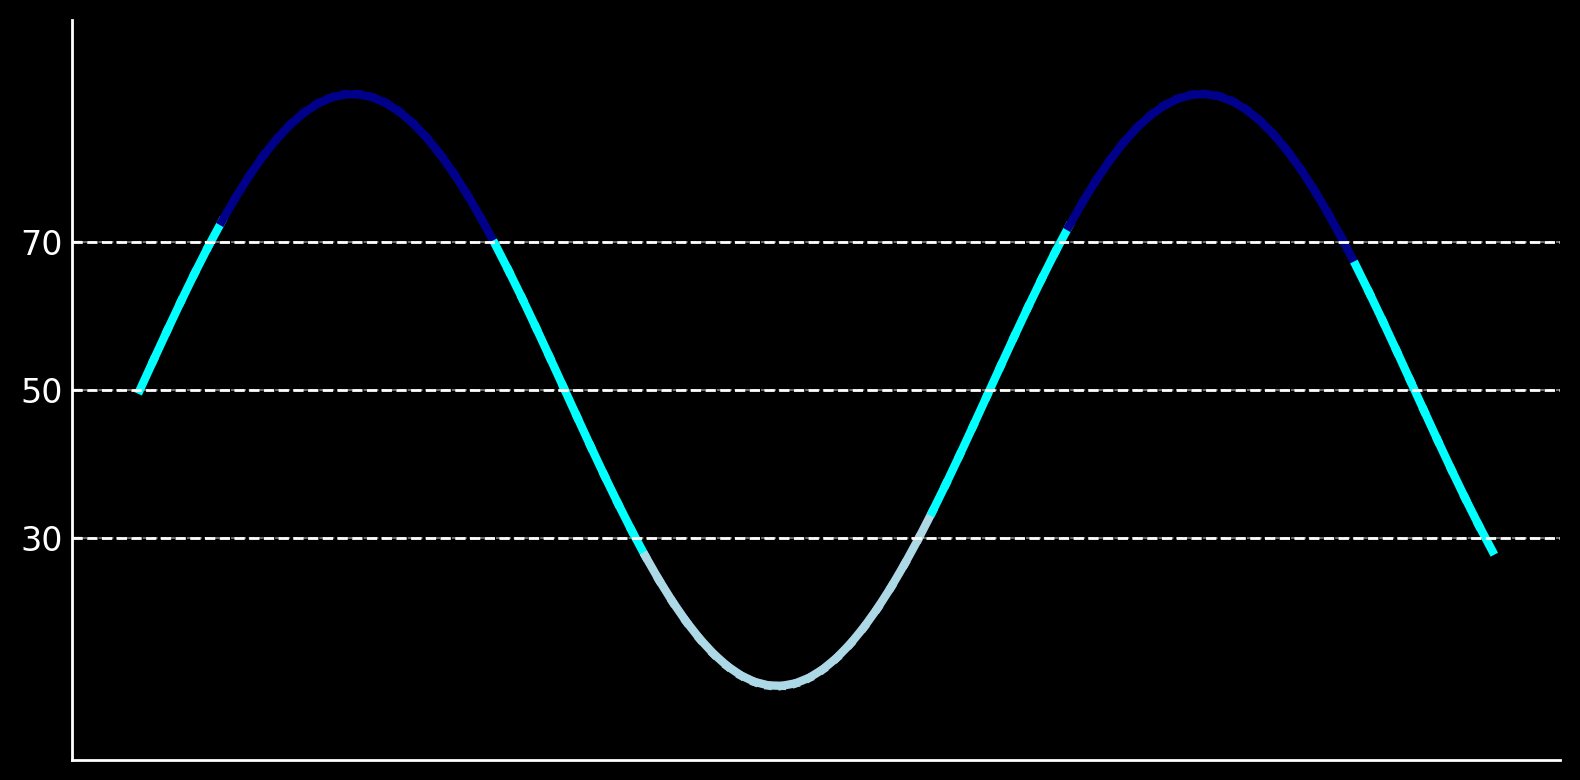
Using RSI in combination with support and resistance levels is a real power move for traders. Imagine an asset’s price approaches a resistance level, and RSI is already signaling overbought conditions - the likelihood of a reversal significantly increases! But it doesn't stop there: many traders also pay attention to divergences. This happens when the price reaches new highs while RSI indicates a weakening trend - time to prepare for a potential reversal.
MACD: Tracking Trends
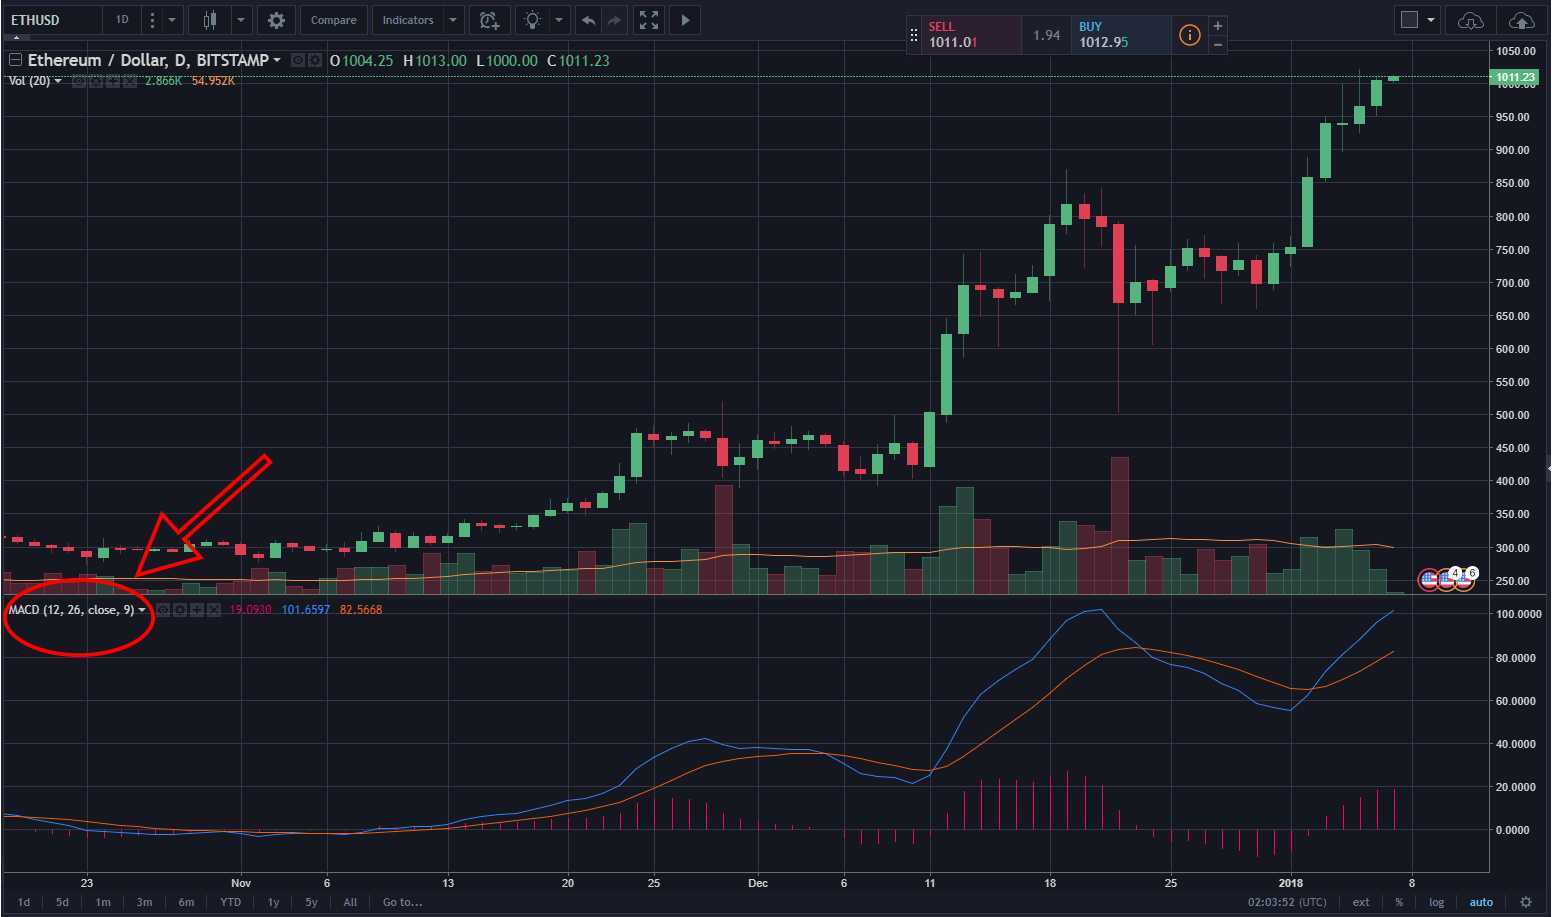
MACD is a trend indicator that measures the difference between two moving averages (usually the 12-day and 26-day EMA) and a histogram that shows the difference between these lines. When MACD crosses its signal line upwards, it’s considered a bullish signal to buy, while a downward cross is a bearish signal to sell. MACD’s main advantage lies in detecting divergences, which signal trend reversals: if the asset price reaches new highs, but MACD shows lower values, this could indicate a weakening trend.
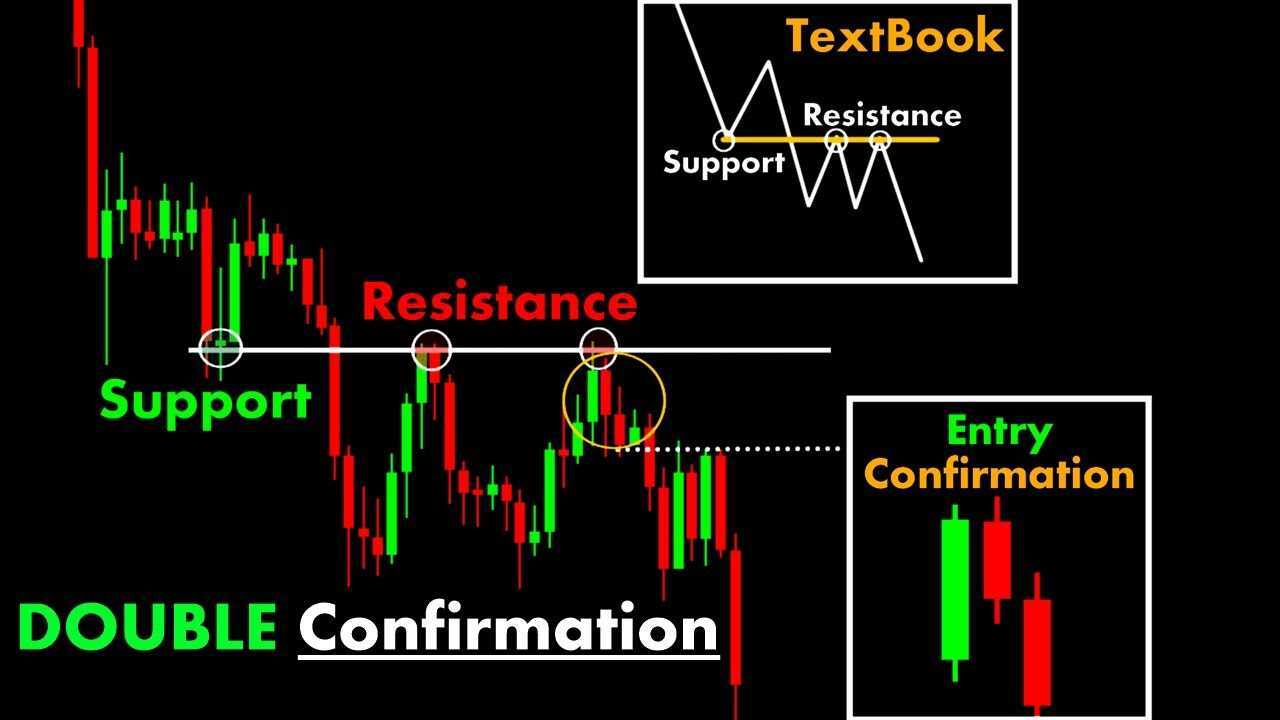
Double Confirmation Strategy
This strategy involves using MACD alongside RSI. For example, if MACD crosses the signal line upwards, and RSI is above 50, this is a buy signal. To exit the position, traders often use MACD’s downward cross below the signal line and RSI’s return to extreme levels (30 or 70).
Divergences are a crucial aspect of advanced MACD use. Bullish divergence occurs when the asset price falls, but MACD shows higher lows - this signals a potential upward reversal. Bearish divergence, on the other hand, suggests a weakening uptrend and potential transition to a decline.
To successfully use these indicators, a reasonable approach to risk management is essential: limit leverage use and always set stop-losses. In volatile cryptocurrency markets, this is your protection against sudden reversals. And remember: although powerful, indicators do not provide 100% accurate signals. They should be used in conjunction with other technical analysis methods for more confident decision-making.
Stochastic Oscillator and Stoch RSI
The stochastic oscillator helps detect moments when an asset becomes overbought or oversold, but unlike RSI, it is based on the range of price fluctuations. Values above 80 indicate overbought conditions, while below 20 signal oversold conditions. When the stochastic oscillator and RSI align, their signals become particularly strong, especially when both show divergences from the price - this is your cue for a potential trend reversal, so don’t miss the moment!
Using the stochastic oscillator alongside RSI gives traders more accurate signals for entering and exiting the market. This is especially important in cryptocurrency markets, where volatility can be high and risk at its peak. The more accurate the signals, the greater the chance of catching a profitable trade.
Fibonacci and Retracement Levels
Fibonacci levels are a powerful tool that helps predict key points of support and resistance. These magical numbers, derived from the famous Fibonacci sequence, act like a map guiding traders through the chaos of the market. They allow you to estimate where the market might reverse after a sharp movement - whether up or down. When everything seems unstable, Fibonacci levels add structure, helping you stay one step ahead.
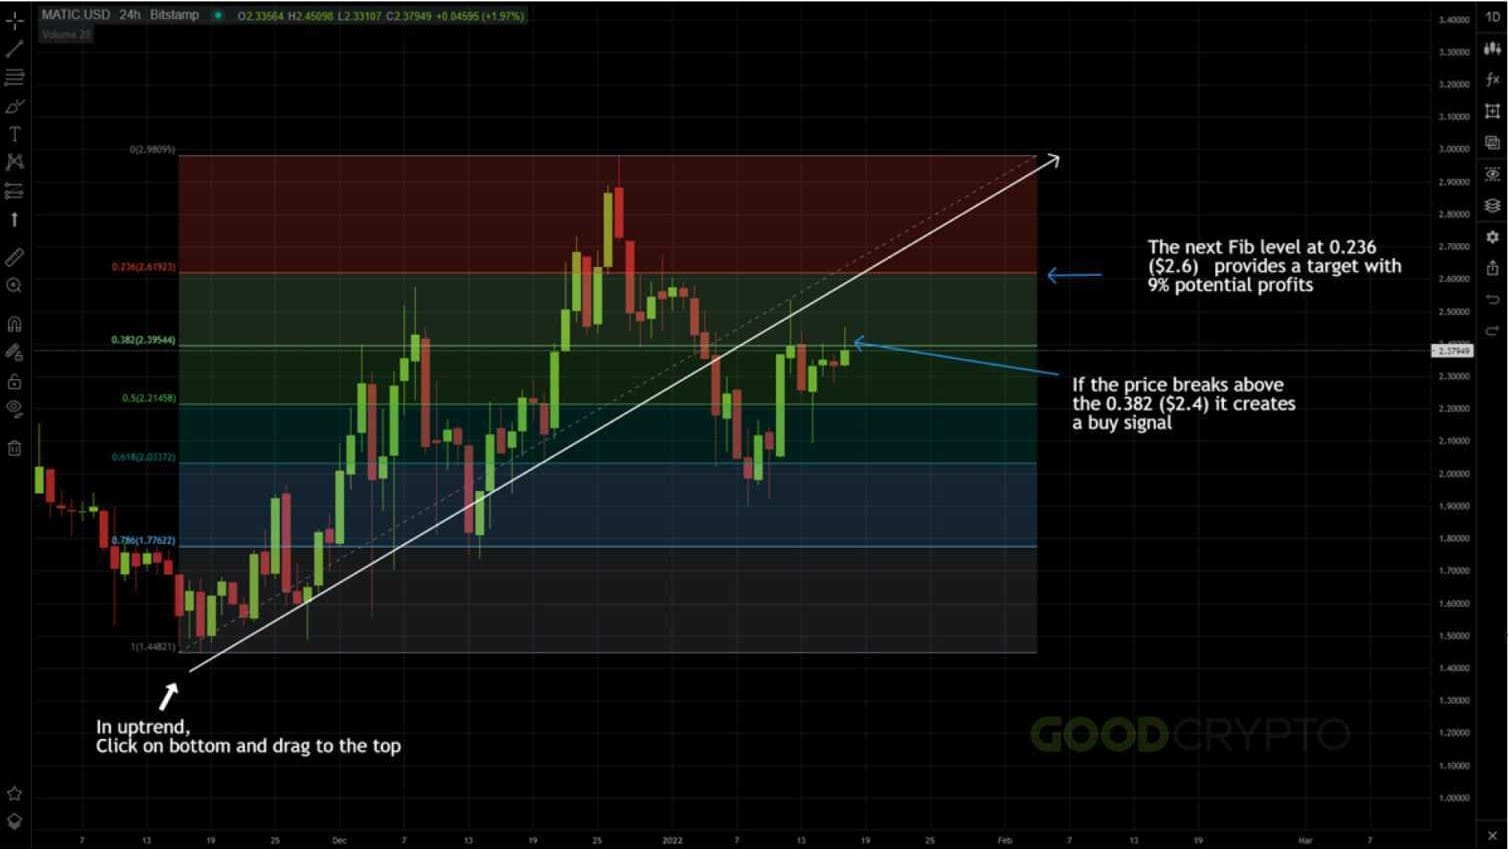
How Fibonacci Levels Work
Traders often use levels of 23.6%, 38.2%, 50%, 61.8%, and 76.4%. These levels are categorized as strong and weak. The stronger the level, the more likely it is that price movement will stall within that range. Among the most powerful levels are 0.382, 0.5, 0.618, and 1.618 - these frequently become key reversal points. For example, if an asset rose from 300 to 500, the 61.8% retracement level will be at 388.2. This level often becomes a critical point for entering or exiting a trade during price corrections.
Combining with Other Tools
To strengthen the signal, traders often combine Fibonacci levels with other indicators. Imagine the 61.8% level coincides with a support level - it’s like getting two green lights at the same time! The likelihood of a price reversal increases dramatically. However, keep in mind: retracement levels work best in the context of a trend. In an uptrend, the 38.2% level can be a great entry point, while in a downtrend, the 61.8% level signals a favorable exit.
How to Use Fibonacci in Trading
Trading based on Fibonacci levels becomes a goldmine if combined with sound risk management. For instance, a stop-loss can be placed just below the 61.8% level to protect against losses. In our case, if the asset price falls below 388.2, the trader can minimize losses. Also, the 50% level, although not a classic Fibonacci level, often acts as a significant retracement point and should not be ignored.
Market Psychology and Fibonacci Levels
Fibonacci levels not only aid in forecasting but also tap into the psychology of the market. When many traders notice that the price has approached an important level, a snowball effect begins. Some rush to buy, while others, conversely, decide to lock in profits. As a result, price movements become predictable, and Fibonacci levels start "working" exactly as the market participants expected. This makes them an almost mystical tool that seems to control the market based on collective thinking.
Elliott Wave Theory
Elliott Wave Theory is a powerful method of financial market analysis, developed by Ralph Nelson Elliott in the 1930s. The basic idea of the theory is simple yet genius: markets move in certain wave patterns that repeat. These waves allow not only to analyze the current state of the market but also to predict future reversals and trends with a certain degree of accuracy.
Key Principles of Elliott Wave Theory
Elliott identified two key types of waves that form the foundation of any market movement:
- Impulse Wave – This wave moves in the direction of the trend and consists of five movements: three of them go up, and the other two go down.
- Corrective Wave – This so-called "correction phase" consists of three waves and occurs immediately after the impulse wave, moving against the trend.

Elliott's main claim was the theory’s versatility, as it can be applied to any timeframe - be it minute charts or yearly ones. Moreover, within each wave, there are smaller waves, creating a complex but logical picture of market movement.
Practical Application
To successfully work with this method, traders need to closely analyze and track charts, identifying the start of wave formations. Traders can also use additional tools such as RSI and MACD to confirm their observations and improve the accuracy of their predictions.
Elliott Wave Theory requires a lot of practice and even more patience. Sometimes it can be challenging to identify the waves, especially in volatile markets. However, despite these difficulties, the Elliott Wave Theory remains a popular method among traders.
Risk Management and Entry/Exit Strategies
Success in trading is not just about reading charts skillfully or predicting market movements. Another key factor is risk management, as even the most accurate forecasts are meaningless without proper capital management.
Basics of Risk Management
Risk management protects a trader’s capital and is designed to minimize losses. Here are a few key principles of managing risks:
- Determine Acceptable Risk Level
How much of your capital are you willing to lose? Decide this percentage upfront to avoid losses if the market takes an unexpected turn. - Set Stop-Losses
This is your "magic button" that can save you from unnecessary losses. Once the price hits the pre-determined level, the stop-loss automatically closes the trade, preventing you from losing more than you're prepared to. - Risk/Reward Ratio
Before opening a trade, assess how much you're willing to lose and how much you can earn. The standard approach is a ratio of at least 1:2 or 1:3, meaning that the potential profit should be several times greater than the possible loss.
Market Entry Strategies
Entry strategies depend on your trading style, but here are a few universal approaches:
- Trend Trading
Following the main trend is the most popular option. It’s straightforward and requires no further explanation. - Trading from Support and Resistance Levels
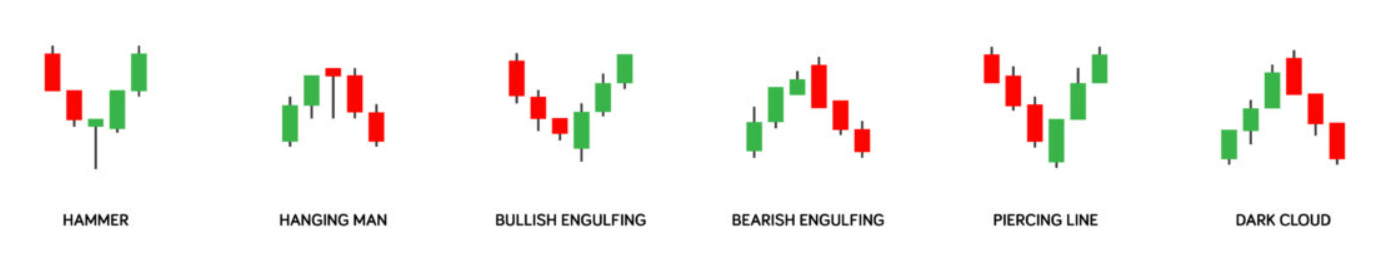
This approach looks at how the price behaves at key points. Does it approach a level? It will either bounce off or break through. Here, three classic strategies come into play: trading the bounce (price moves away from the level), catching the breakout (price breaks through and sets a new trend), or using a mixed approach. - Technical Patterns
This approach is for you if you can recognize and use various patterns.
Market Exit Strategies
Exiting a trade is an art that’s just as important as entering. A wrong exit can wipe out your profit or, conversely, prevent you from cutting losses in time. Here are a few strategies:
- Take-Profit
Similar to a stop-loss, a take-profit automatically closes the trade once the price hits the desired level. This helps secure profits and allows you to sleep soundly, without worrying about sudden market movements. - Trailing Stops
This is your reliable assistant in dynamic markets. A trailing stop follows the price when it moves in your favor, locking in profits, but stays in the trade until a reversal occurs. - Exiting Based on Indicator Signals
Indicators like RSI or MACD help you exit trades at the right time. When they signal overbought or oversold conditions, it may be time to lock in profits or close the position.
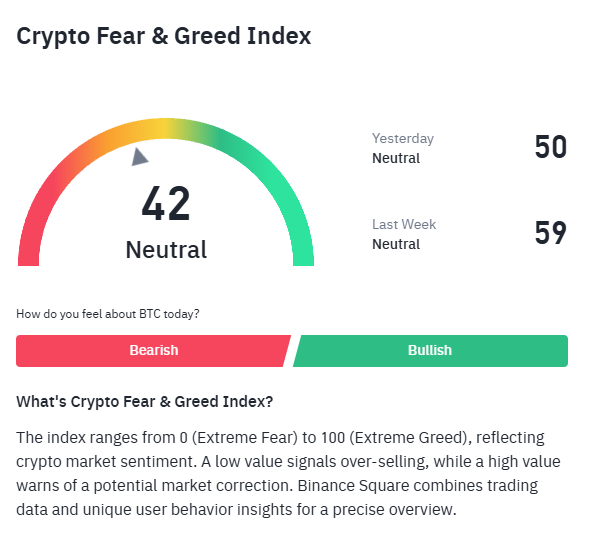
Market Psychology
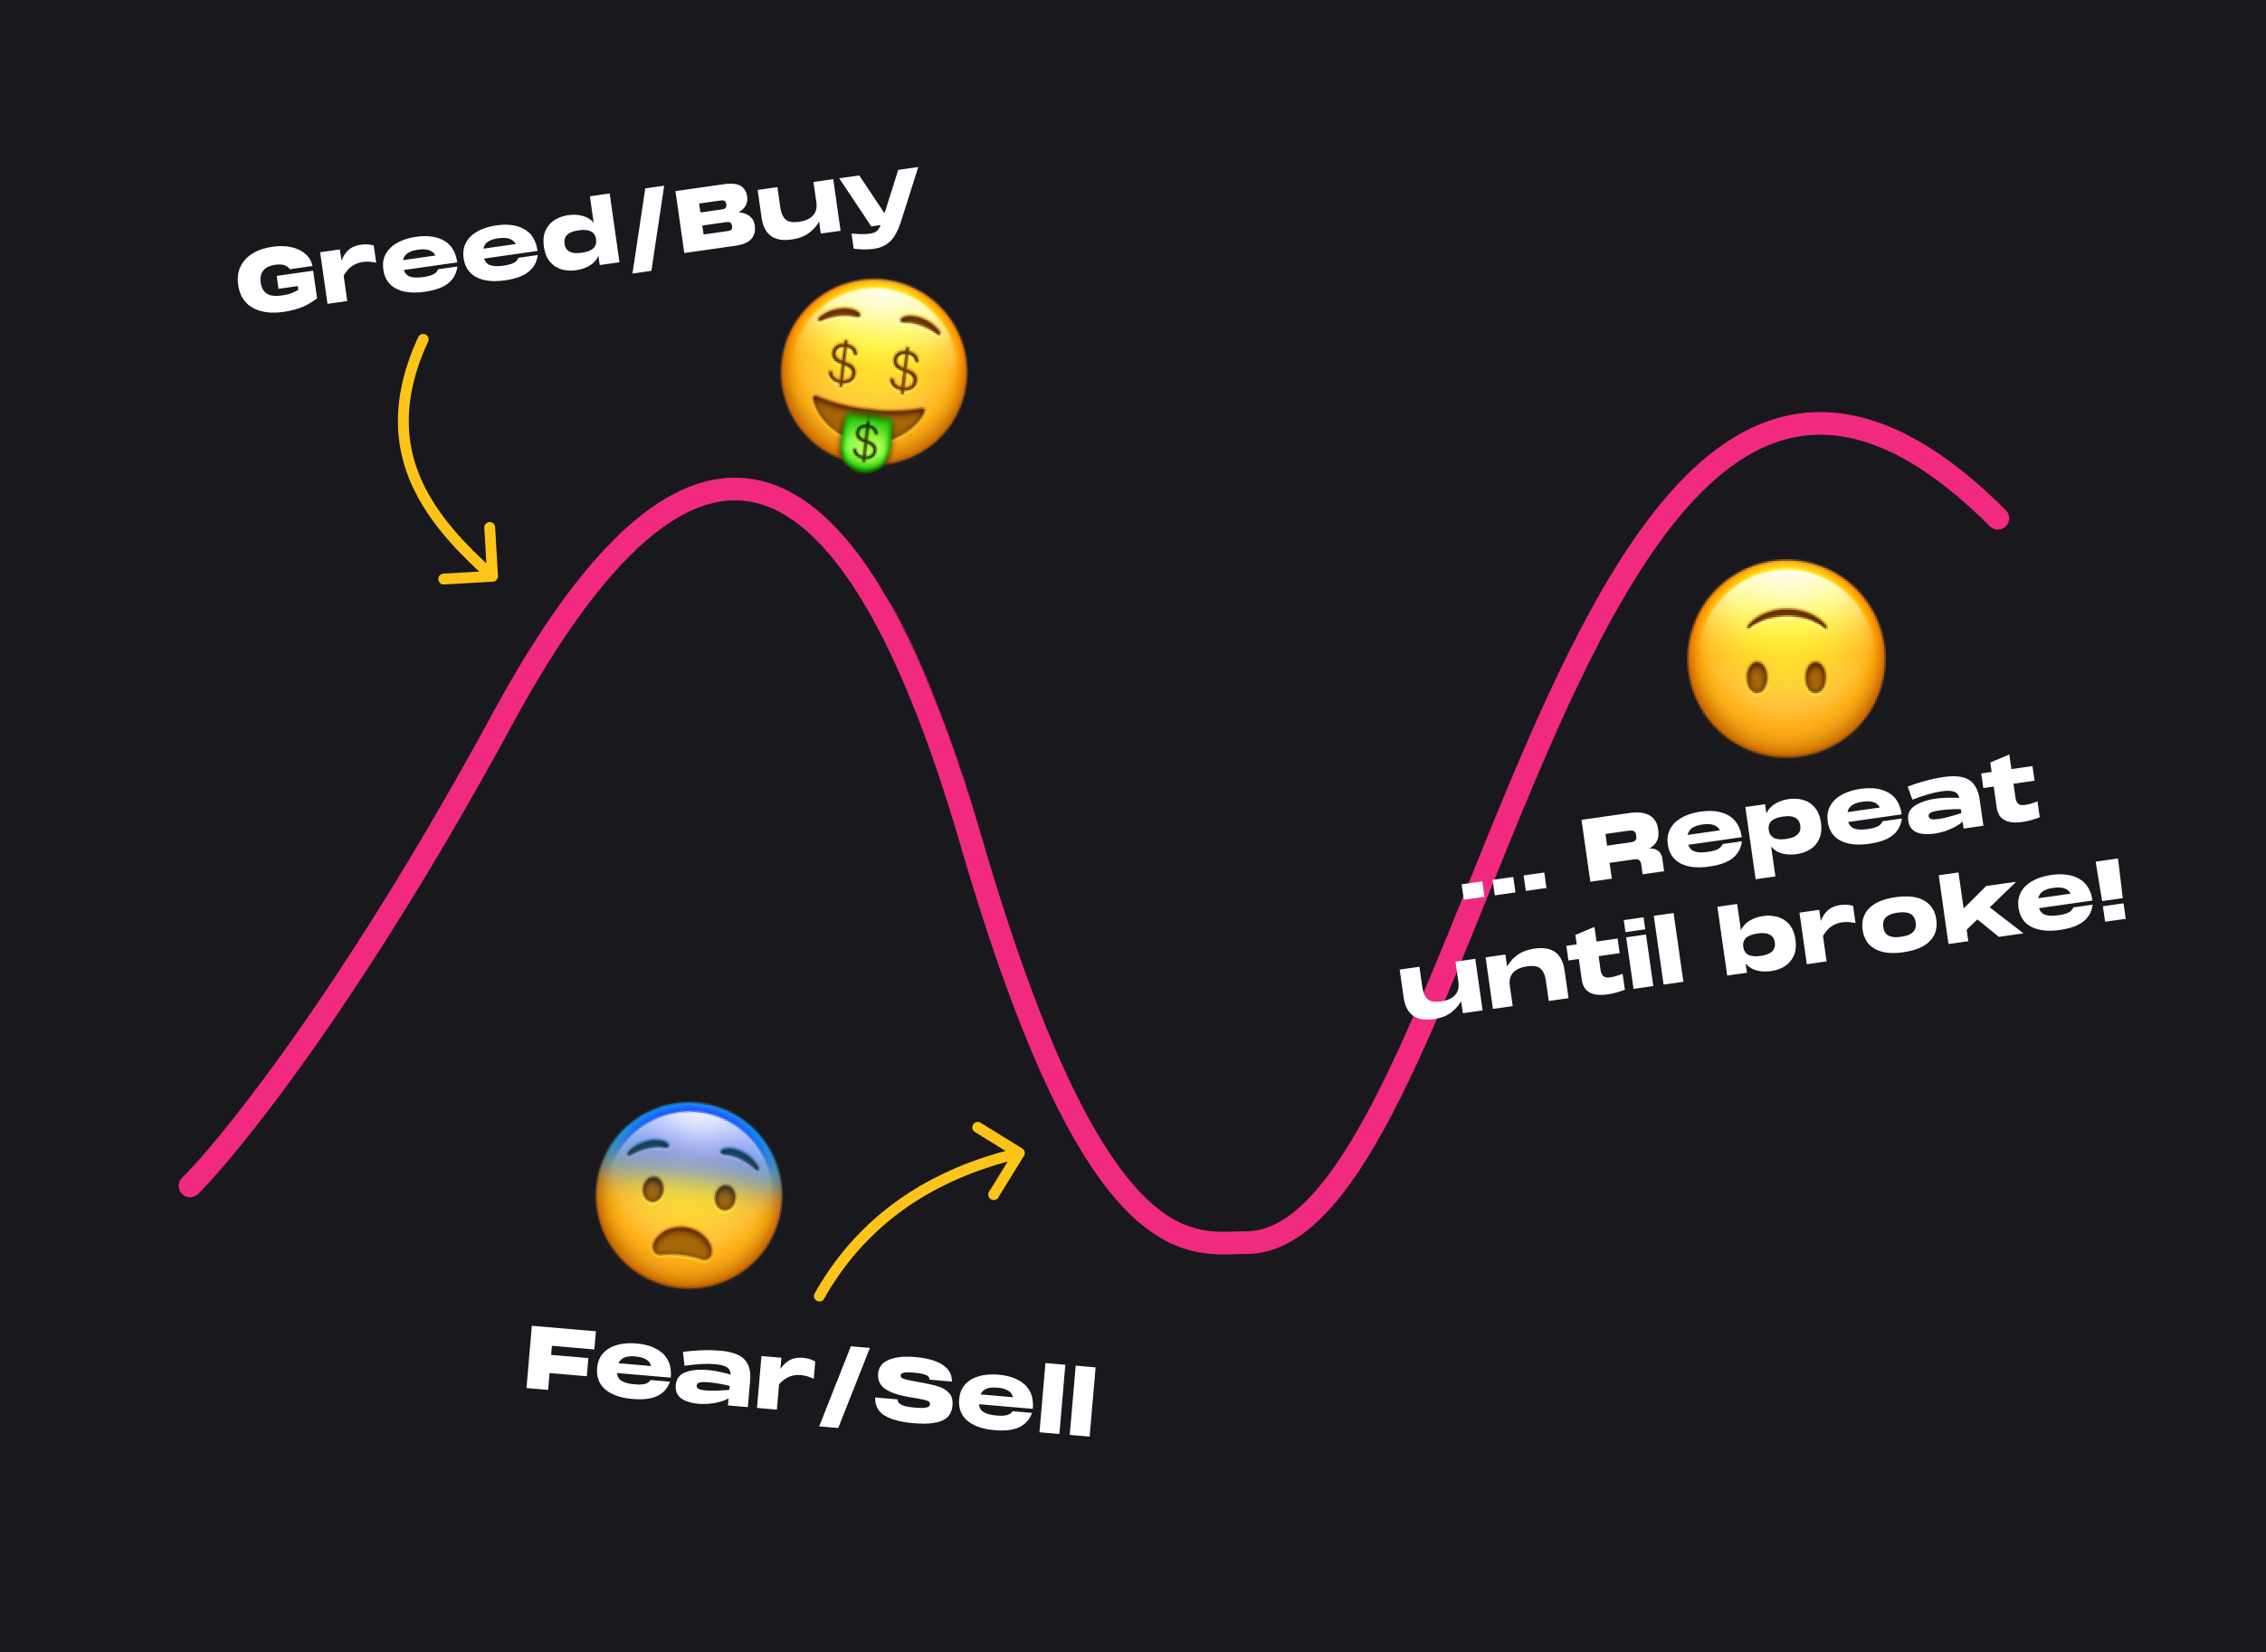
Trading on financial markets, especially highly volatile ones like cryptocurrencies, isn’t just about numbers and charts. The behavior of participants, their fears, greed, and emotions can dramatically influence price movements. Understanding the psychology of trading is key to avoiding common mistakes and becoming more disciplined in decision-making.
Emotions in Trading
Fear and greed are the main enemies of a trader, especially in volatile markets. When the market falls, fear drives panic selling, often leading to exiting profitable trades prematurely. On the other hand, greed tempts a trader to wait for even more growth, even when an asset has already peaked, resulting in lost profits when the trend reverses. The reason lies in how our brain works: the desire to grab everything at once overrides rational thinking. To avoid falling into these emotional traps, you must develop discipline and adhere to clear rules. A long-term assessment of results and cold calculation are your best allies in the battle against fear and greed.
The Herd Instinct Phenomenon
The herd instinct is another trap traders fall into. When the price rises or falls sharply, the crowd starts acting similarly - buying or selling en masse. Newcomers, seeing these wild movements, get caught up in this herd mentality and make emotional trades, which rarely end well.
At such times, it's important to stay calm and stick to your trading strategy, resisting the temptation to follow the crowd.
The Psychology of Success
The path to successful trading lies through discipline and confidence in your actions. Here are a few principles that will help you become a more confident trader:
- Clear Plan and Strategy
Trading without a clear plan inevitably leads to emotional and impulsive decisions. A well-thought-out strategy allows you to keep your cool even during the most volatile market periods. - Accepting Losses
Losses, unfortunately, are an integral part of trading. It’s essential to learn when to admit a mistake and exit a losing position, instead of letting your ego deepen the losses. - Patience
Unpredictability is the hallmark of cryptocurrency markets, so patience and the ability to wait for the right moment to enter or exit a trade are traits every successful trader should have.
Avoiding FOMO and FUD
FOMO and FUD are two common terms frequently used in crypto communities. FOMO (Fear of Missing Out) is when you fear missing out on your “golden opportunity,” rushing into a trade at the peak, just to not be left behind. The result: the market reverses, and the dream of quick profit vanishes. FUD (Fear, Uncertainty, and Doubt) is the opposite: fear, uncertainty, and doubt overwhelm you at the first sign of bad news. You panic and sell off your assets without giving yourself time to assess the situation, only to watch the market climb again later. Both of these phenomena can be a trader’s worst enemies.
Validate the news by referring to information from multiple sources. Don’t make hasty decisions based on a single opinion or publication.
Analysis Tools on DYOR.io
The DYOR.io platform has everything you need to deeply analyze cryptocurrency charts, just select the cryptocurrency you want and enable TradingView.
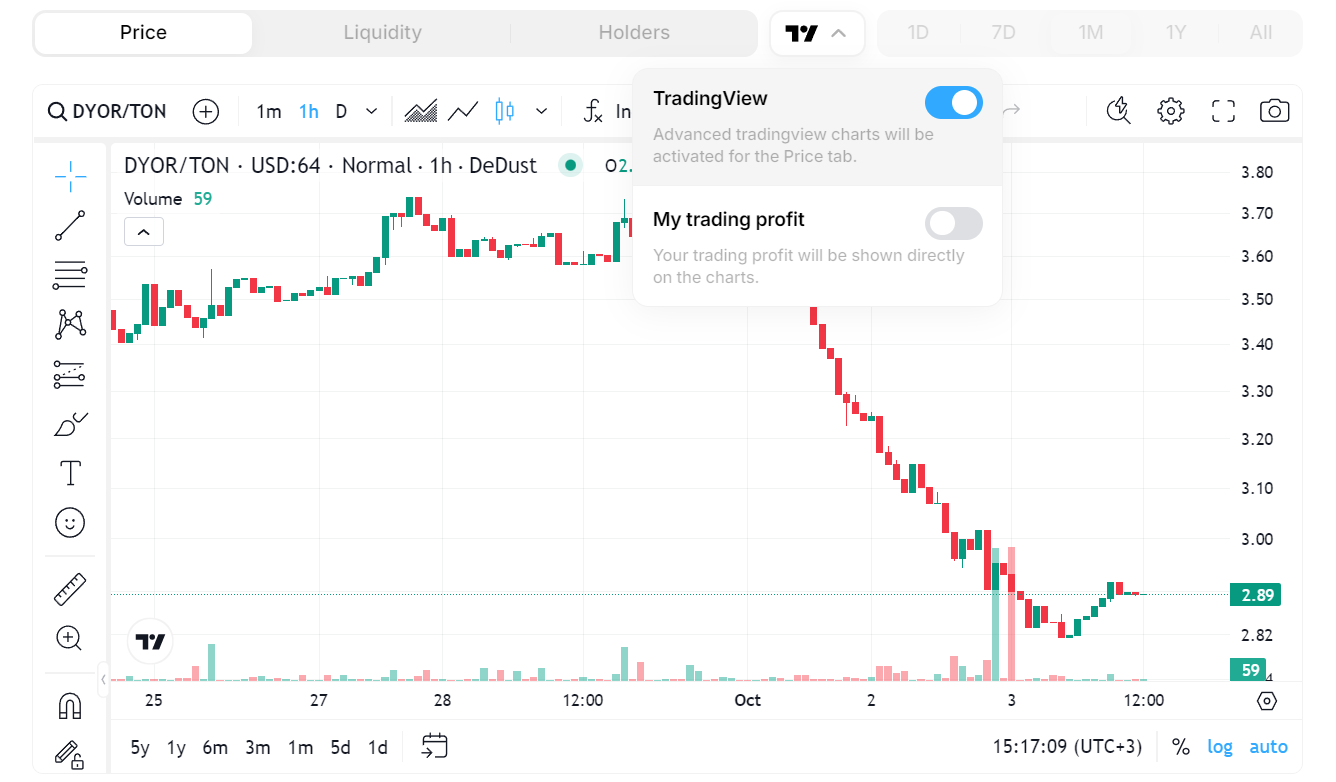
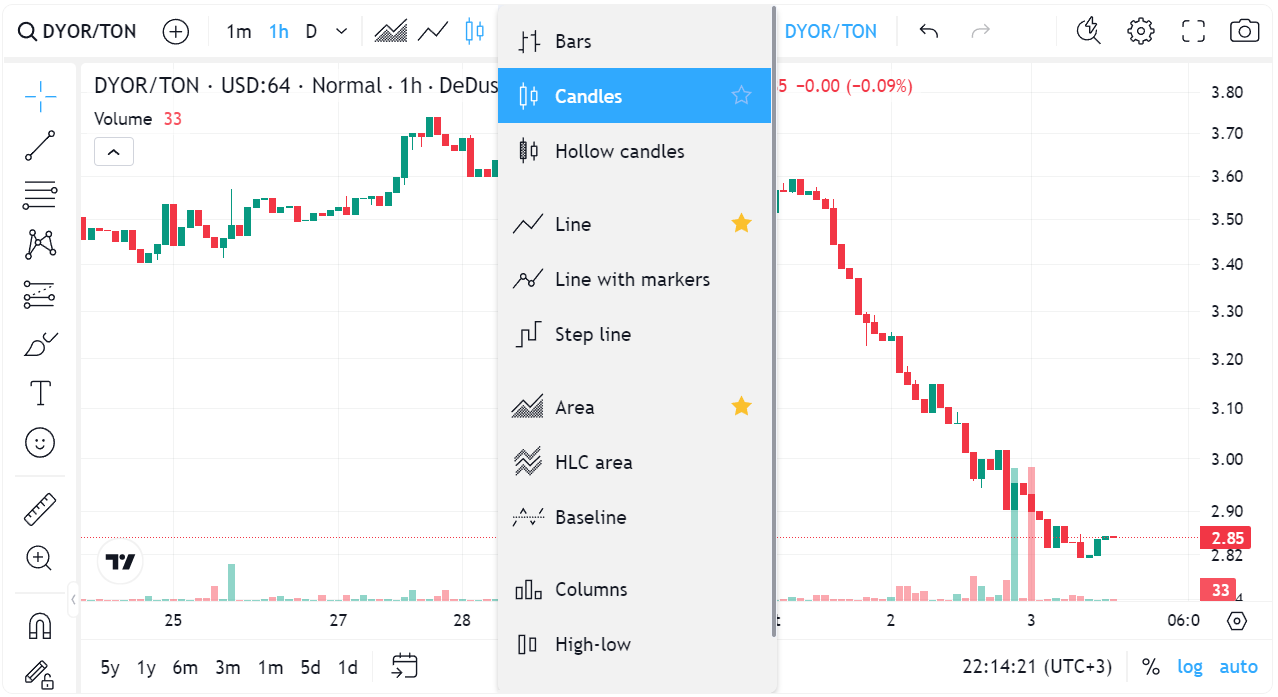
You can choose any type of chart: candles, bars, lines, or steps - whatever suits your style. You can analyze both short-term periods of 1 minute and long-term trends over several years - the platform supports it all.
For those who enjoy advanced analysis, everything we mentioned in this article is available: trend lines, Fibonacci levels, indicators like RSI and MACD - in short, a full arsenal for precise signals.
One of the coolest features is the ability to draw directly on the chart. Add trend lines, mark key levels, and leave notes right on the chart - everything to make your analysis as clear and visual as possible.
And of course, you can save your charts and customize them. This allows you to quickly switch between assets and always have all the necessary data at hand.
Conclusion
Cryptocurrency charts are more than just numbers and lines - they are your compass in the world of trading. RSI, MACD, Fibonacci, Elliott waves - these are all tools that will help you not just analyze the market but also understand its sentiment.
But what good are all these tools if you give in to emotions? Fear will force you to exit a trade too early, and greed will make you hold onto an asset for too long, missing the moment. Discipline is what separates a successful trader from one who follows their emotions. Calmness and a clear strategy are your main allies in the storms of the market.
Remember, your success is not just about using the right tools but also about your ability to control yourself. Manage your emotions, follow your plan, and the market will work in your favor.
Trending tokens
See all