How to read crypto charts: guide for beginners

Cryptocurrency charts are not just a bunch of numbers on the screen of your phone or computer. They represent a new way to make and manage money, requiring the ability to read specialized charts
If you are just beginning to dive into the world of cryptocurrency, this article is for you. We will cover the concept of candlestick charts, the significance of trading volume, support and resistance levels, and how to use analysis tools not just to track price changes, but to try to predict them. Knowing these basics will help you take confident steps in investing and not get lost among market trends.
Cryptocurrency analysis is not just about viewing charts; it's your compass in the world of digital money. It helps understand where prices are heading, how many transactions are happening, and what the total market value is. With its help, you can predict future changes and make the right moves in investments.
This analysis is crucial whether you are a trader or an investor. It allows you to move from guessing to making informed decisions based on data and trends. Thanks to various tools - from charts to data analysis - you can better understand what's happening in the market and plan your actions.
Two keys to understanding the market: fundamental and technical analysis
Both fundamental and technical analyses help make sense of cryptocurrencies, but from different angles. Combining both gives a complete picture of what's happening in the market and helps make confident financial decisions.
Fundamental analysis looks at the intrinsic value of a cryptocurrency, analyzing everything from the development team to how it is perceived in the market.
Key aspects of fundamental analysis:
- Technology and team: Studying the technology behind the cryptocurrency and the experience of the team can tell a lot about the project's potential.
- Market potential: Assessing how much the product is needed in the market and how it can stand out among competitors.
- Regulatory conditions: Understanding how legislation can affect the future of cryptocurrency.
Challenges of fundamental analysis:
- Lack of data: Many crypto projects are too new to have a complete history, which complicates analysis.
- High volatility: Wide price fluctuations can mislead about the real value of an asset.
- Regulatory uncertainty: The constantly changing regulatory environment requires flexibility in forecasts.
Technical analysis focuses on prices and sales volumes, studying past and present data to predict future trends.
Technical analysis tools:
- Price charts: Show the history of price movements, helping to see trends and patterns.
- Trading volumes: Reflect market activity, confirming the significance of price changes.
- Moving averages: Smooth out price fluctuations, highlighting the main trend.
- Oscillators (RSI, MACD, Stochastic): Help understand whether the currency is overbought or undervalued.
- Market sentiment: Reflect the general mood of investors
Technical analysis is most often used by traders and investors for reading cryptocurrency charts. So, how do you read cryptocurrency charts?
Candles
A candlestick chart is a chart where each "candle" displays price dynamics for a selected period. Candlestick charts are used more often than regular bar charts, and their advantages include visibility and the ability to better see price dynamics.
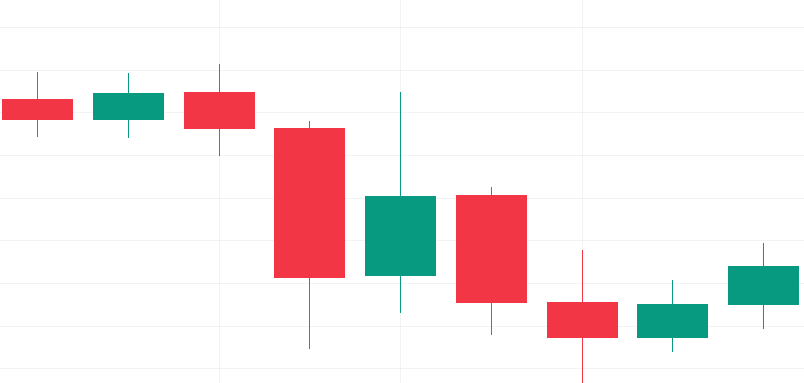
- The body of the candle shows the difference between the opening and closing prices.
- The length of the body indicates the pressure from buyers or sellers.
- The shadows (or "wicks") display the maximum and minimum prices for the period.
- The length of the wicks indicates the maximum and minimum prices reached during the period and helps determine the stability of the trend.
- The color of the candle body shows the direction of price movement. Green candles indicate a price increase during the period ("bullish" trend). Red candles indicate a decrease in prices ("bearish" trend).
Start by learning a few basic candlestick patterns - they will be your first steps towards successful trading.
For example, there are flags and pennants, "evening star", various triangles, "head and shoulders", "double top", "double bottom", cups and handles, channels, ranges, and a huge number of other patterns. Each graphical model is unique and helps calculate the right moments to enter or exit a trade to earn. Different patterns suit different cryptocurrencies, so it's crucial to understand exactly how to apply this information to your specific market situation.
At first glance, all this may seem very complicated, but the main thing here is experience. Don't give up right away, this path will not be quick and easy, calculate the risks and arm yourself with patience.
Trading volumes
If you want to understand how lively the cryptocurrency market is, look at the trading volumes. It's like a thermometer of activity: the higher the volume, the hotter the atmosphere. Volume shows how many times a coin has changed hands over a certain period - this is your insider's view of the asset's popularity.
What is trading volume and why is it important?
Trading volume is the sum of all transactions with cryptocurrency for a day, hour, or any other selected interval.
Trading volume will tell you how seriously the market takes a particular coin. A large volume signals strong interest - it can be both a rocket launched into space and the first sign of an impending crash. Price spikes attract traders like moths to a light, and trading volume will show whether something serious is really happening behind the scenes or if everything will calm down as suddenly as it started.
How to interpret trading volume?
High volume with rising prices may mean that big players have entered the game, and the market is on the rise.
Low volume may indicate a lack of interest, making any price movement less convincing.
Connection of volume and trends
Rising trends with high volume? It means the market is strong and healthy. If prices fall and volume grows, it could be a harbinger of big problems.
How to use it?
If you see a sharp price jump without a corresponding increase in volume, be on the alert - it might be a trap. On the other hand, consistently high volume with rising prices may be a green light for investments.
Support and resistance levels
When it comes to reading cryptocurrency charts, support and resistance levels are your best friends. They are like beacons in a foggy market, indicating where the price may stop or rebound.
- Support levels are prices where buyers usually enter the game, supporting the price from further falling.
- Resistance levels are like a price ceiling, where sellers start to sell actively, not allowing the price to rise higher.
How to find them?
Use trend lines to connect the minimums or maximums of prices and see where support and resistance might be possible:
- Rising trend lines are drawn by the lowest points - these are support levels.
- Descending trend lines connect the highest points - here are the resistance levels.
Application in practice
Watch these levels to determine when to buy or sell. If the price of a cryptocurrency approaches the support line during an upward trend, it might be a good opportunity to buy. If it approaches the resistance line during a downward trend - it might be time to sell.
What if the price goes sideways?
Sideways movement - also known as consolidation or flat. If a cryptocurrency does not show a clear trend and fluctuates within a narrow range, support and resistance levels will help determine the boundaries of this channel. A breakthrough or breakdown of the price beyond these boundaries may signal the beginning of a new trend.
Tip: Use long-term moving averages to see the overall trend and reinforce your observations of support and resistance levels. These indicators will help you stay on the wave, even if the market behaves unpredictably.
The cryptocurrency market is always full of surprises. Therefore, before you start trading, it is critically important to develop and constantly update your risk management strategy. Here are a few life hacks:
- Stop-loss - your best friend. This is the most reliable way to limit losses if the market suddenly goes not according to your scenario.
- Profit target. Determine in advance at what price level you will fix the profit, so as not to miss your moment.
- Trailing stop. An excellent tool for protecting already earned profits, which automatically closes a deal when the price drops.
- Control the size of the position. Do not put all your eggs in one basket - manage the size of the bets to avoid disaster on one unsuccessful trade.
- Hedging. This is like insurance for your portfolio - open positions on other assets to compensate for possible losses.
- Аnd, of course, always do your own research.
Trending tokens
See all